Over the past few decades, research into animal calls has developed rapidly, with advances in recording equipment and analytical techniques providing new insights into animal behavior, population distribution, taxonomy, and anatomy.
In a new study published in the journal Ecology and Evolution, we reveal limitations in one of the most common methods used to analyse animal sounds that may have led to disagreements about whale songs in the Indian Ocean, as well as the calls of animals on land.
We present a new method that can overcome this problem, revealing previously hidden details of animal calls and providing the basis for future advances in the study of animal calls.
The Importance of Whale Song
With over a quarter of cetacean species listed as vulnerable, endangered or critically endangered, understanding their behaviour, population distribution and the impacts of anthropogenic noise is key to successful conservation efforts.
For creatures that spend most of their time hidden in the vast open ocean, these are tricky things to study, but analysing whale songs can provide important clues.
But we can't just listen to and analyze whale songs – we need a way to measure them in more detail than the human ear can pick up.
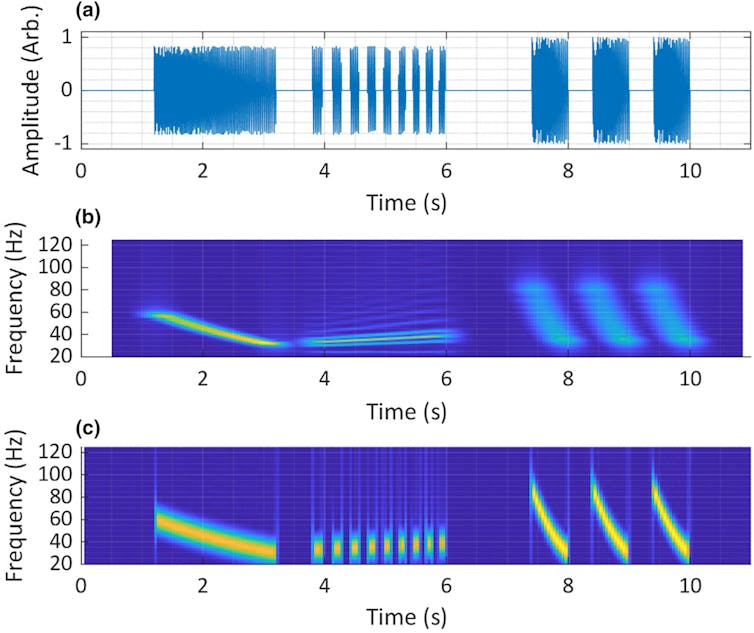
For this reason, the first step in studying animal sounds is to generate a visualization called a spectrogram, which helps us better understand the characteristics of the sound – specifically, it shows when the sound energy occurs (time details) and at what frequencies it occurs (spectral details).
Careful examination of these spectrograms and measurement with other algorithms can reveal the structure of the sound in terms of time, frequency and intensity, allowing for deeper analysis. They are also an important tool for communicating your findings when publishing your research.
Why are spectrograms limited?
The most common method for generating spectrograms is known as the STFT, which is used in many disciplines, including mechanical engineering, biomedical engineering, and experimental physics.
However, it is known to have a fundamental limitation: it is not possible to accurately visualize all the temporal and spectral details of a sound simultaneously, meaning that all STFT spectrograms sacrifice some temporal or spectral information.
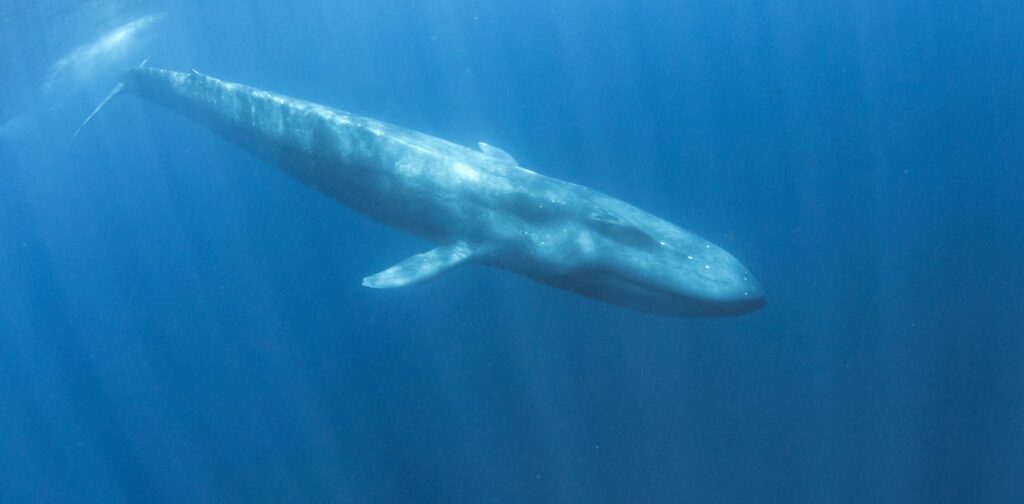
This problem is more pronounced at low frequencies, which is particularly problematic when analyzing the calls of animals like pygmy blue whales, whose calls are so low-pitched that they are near the lower limit of human hearing.
Prior to my PhD, I worked in the field of acoustics and audio signal processing, where I became familiar with the STFT spectrogram and its shortcomings.
However, there are many different ways to generate spectrograms, and we thought that the STFT used in the whale song study might hide details, and that there might be other methods that are better suited to this task.

Jankovic & Rogers, 2024
In our study, co-author Tracey Rogers and I compared STFT with our new visualization technique. We used fictitious (synthetic) test signals as well as recordings of other animals, including pygmy blue whales, Asian elephants, cassowaries, and American crocodiles.
The method we tested included a new algorithm called the Superlet transform, an improvement over one originally used in EEG analysis. We found that our method could visualize synthetic test signals with up to 28% less error than other methods we tested.
A better way to visualize animal sounds
The results were promising, but Superlet's full potential was realized when it was applied to animal sounds.
Recently, there has been some disagreement about whether the initial sound of Chagos pygmy blue whale song is a “pulse” or a “tonal” sound. These two terms imply that there are extra frequencies in the sound, but they are produced in two different ways.
This debate cannot be resolved because an STFT spectrogram can show this sound as either a pulse or a tone depending on how it is set up. Superlet's visualization shows the sound as a pulse, which is consistent with most studies describing this song.
When visualizing Asian elephant calls, Superette showed a pulsation that was mentioned in the original description of the sound but was missing from all subsequent descriptions, and was never shown in a spectrogram.
Superlet visualizations of cassowary calls and American alligator roars, both of which showed previously unreported temporal details not shown in spectrograms from previous studies, showed that cassowary calls and alligator roars were not visible in the roars.
These are only preliminary findings based on a single recording each; many more sounds need to be analyzed to confirm these observations. Still, this is fertile ground for future research.
Beyond its increased accuracy, ease of use may be Superlet's greatest strength: Many researchers who use sound in animal studies come from backgrounds in ecology, biology, or veterinary medicine, and they learn audio signal analysis only as a means to an end.
To increase the accessibility of the Superlet transform to these researchers, we have implemented it in a free, easy-to-use open-source software app, and we look forward to seeing what new discoveries they make using this exciting new method.

